Tensorflow-Visualizing
Make deep learning easy…
Tensorflow Visualization Tool
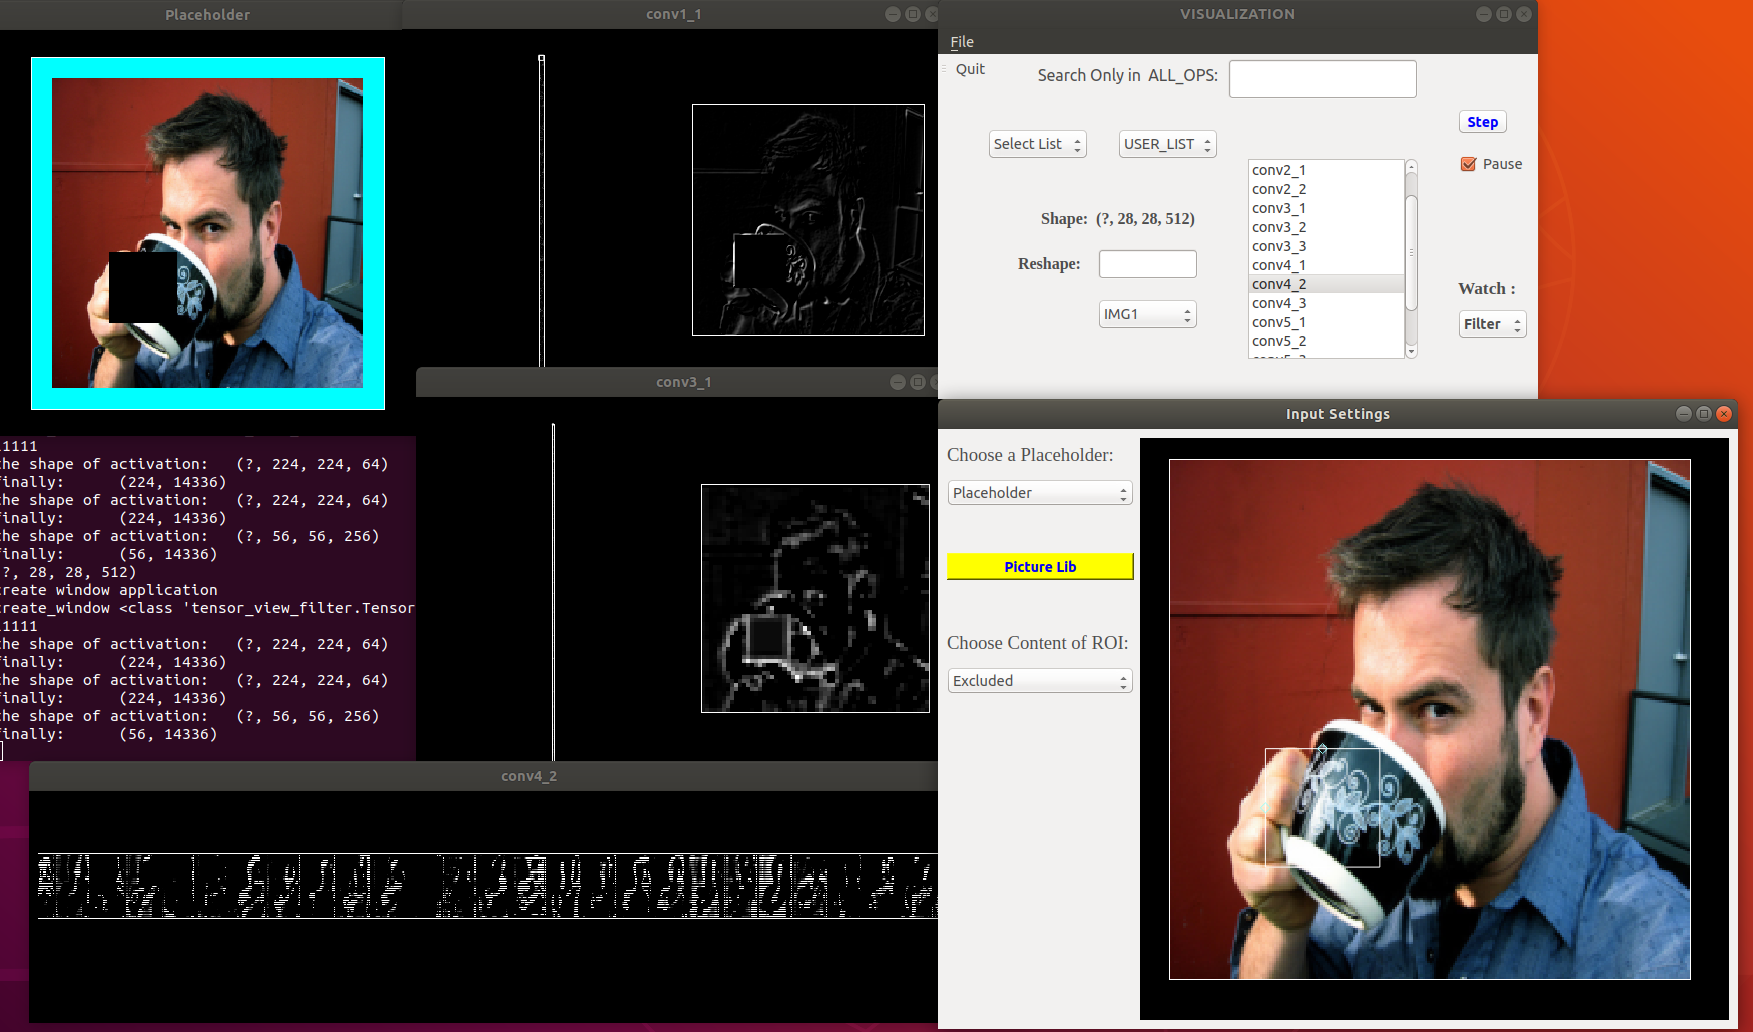
This is a tensorflow visualization tool that helps monitor the real-time data in TensorFlow programs. It is a general tool not only for CNN visualization, but also for some other deep learning code. By adding a few lines in the code, user can watch most of tensors they are interested in. It could help people debug the code and check if the code is learning the certain features, and gain a better insight of the neural network.
The idea comes from the Deep Visualization Toolbox for Caffe (https://github.com/yosinski/deep-visualization-toolbox) and the work of https://github.com/InFoCusp/tf_cnnvis. We want to build a general tool that implements some visualization functions of TensorBoard, but with simple APIs and easy setup. Moreover, with the help of high performance of pyqtgraph, this tool can render the real-time data during the training. Extensibility is also our consideration. For now, we provide 1-dimensional and 2-dimensional visualization, particularly for activations and filters of CNN. More types of visualization will be supported in the future.
Requirements
- Tensorflow
- Numpy
- Pyqtgraph
Setup
In terminal, clone the repository to a directory
git clone https://github.com/octaviaguo/Tensorflow-Visualizing.git
And run (take GAN.py in the test file as an example)
python3 GAN.py
API
- Import TensorMonitor to the file.
import sys sys.path.append("../../") from TensorMonitor.tensor_manager import TensorMonitor - Customize a list to watch.
TensorMonitor.AddUserList( node_name1 = node1, node_name2 = node2, ...) - Activate the visualization tool.
 TensorMonitor.Beat(sess,
   input_name1 = feed_dict1,
   input_name2 = feed_dict2,
   ...)
Examples